Chatbot Analytics
info
This guide provides an overview of the Chatbot Analytics feature— what insights it offers, how to access and interpret those insights, and how they can be used to drive better business decisions.
By understanding key metrics and user interactions, you can uncover opportunities to improve customer experience, optimize chatbot performance, and gain a competitive edge through data-driven actions.
In Thinkstack, Chatbot Analytics gives you a clear snapshot of how your chatbot is performing and how users are engaging with it. From identifying usage patterns to tracking outcomes, these insights help you fine-tune conversations and align your chatbot strategy with business goals.
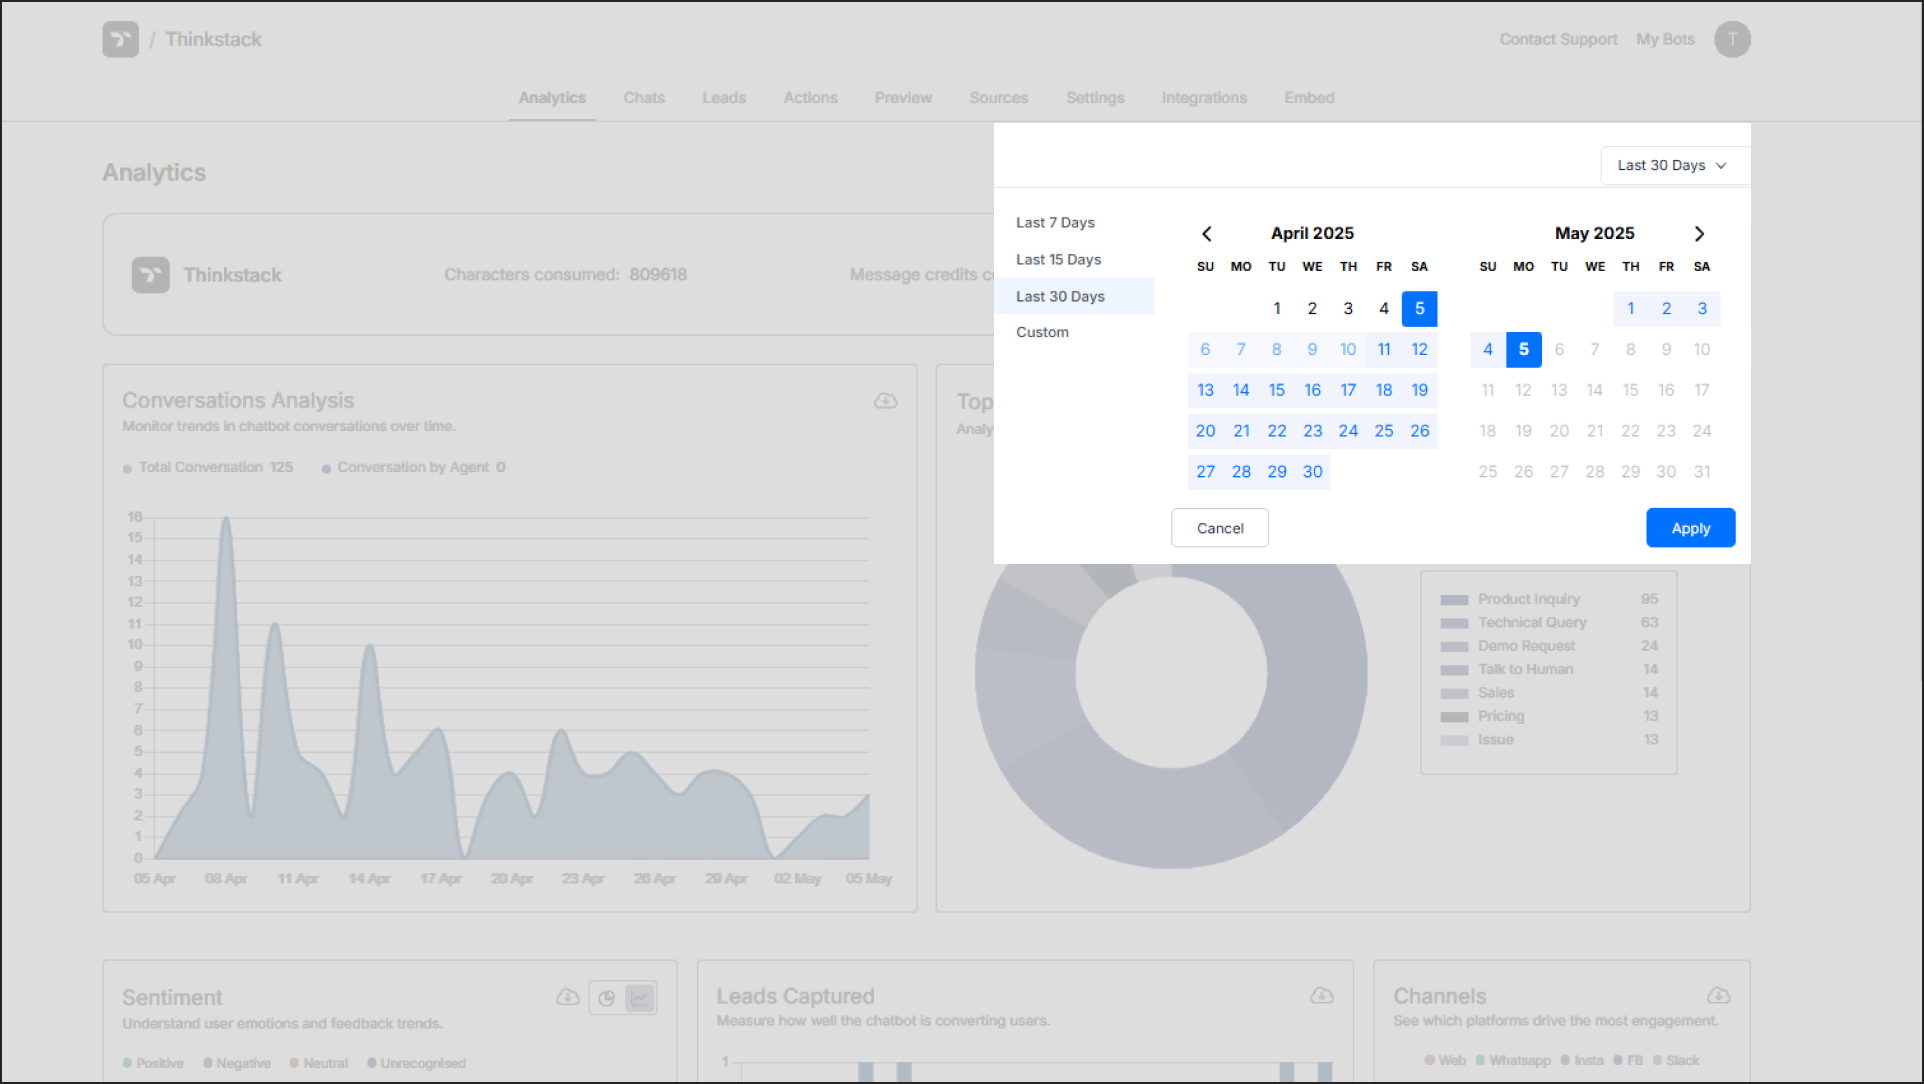
To view analytics for a specific chatbot, click on the chatbot in your dashboard and navigate to the Analytics tab.

tip
Use the time filter to focus on a specific period and explore the available metrics.
Understanding the Chatbot Analytics#
The Analytics section provides key metrics at a glance, giving you a summary of your chatbot's activity:
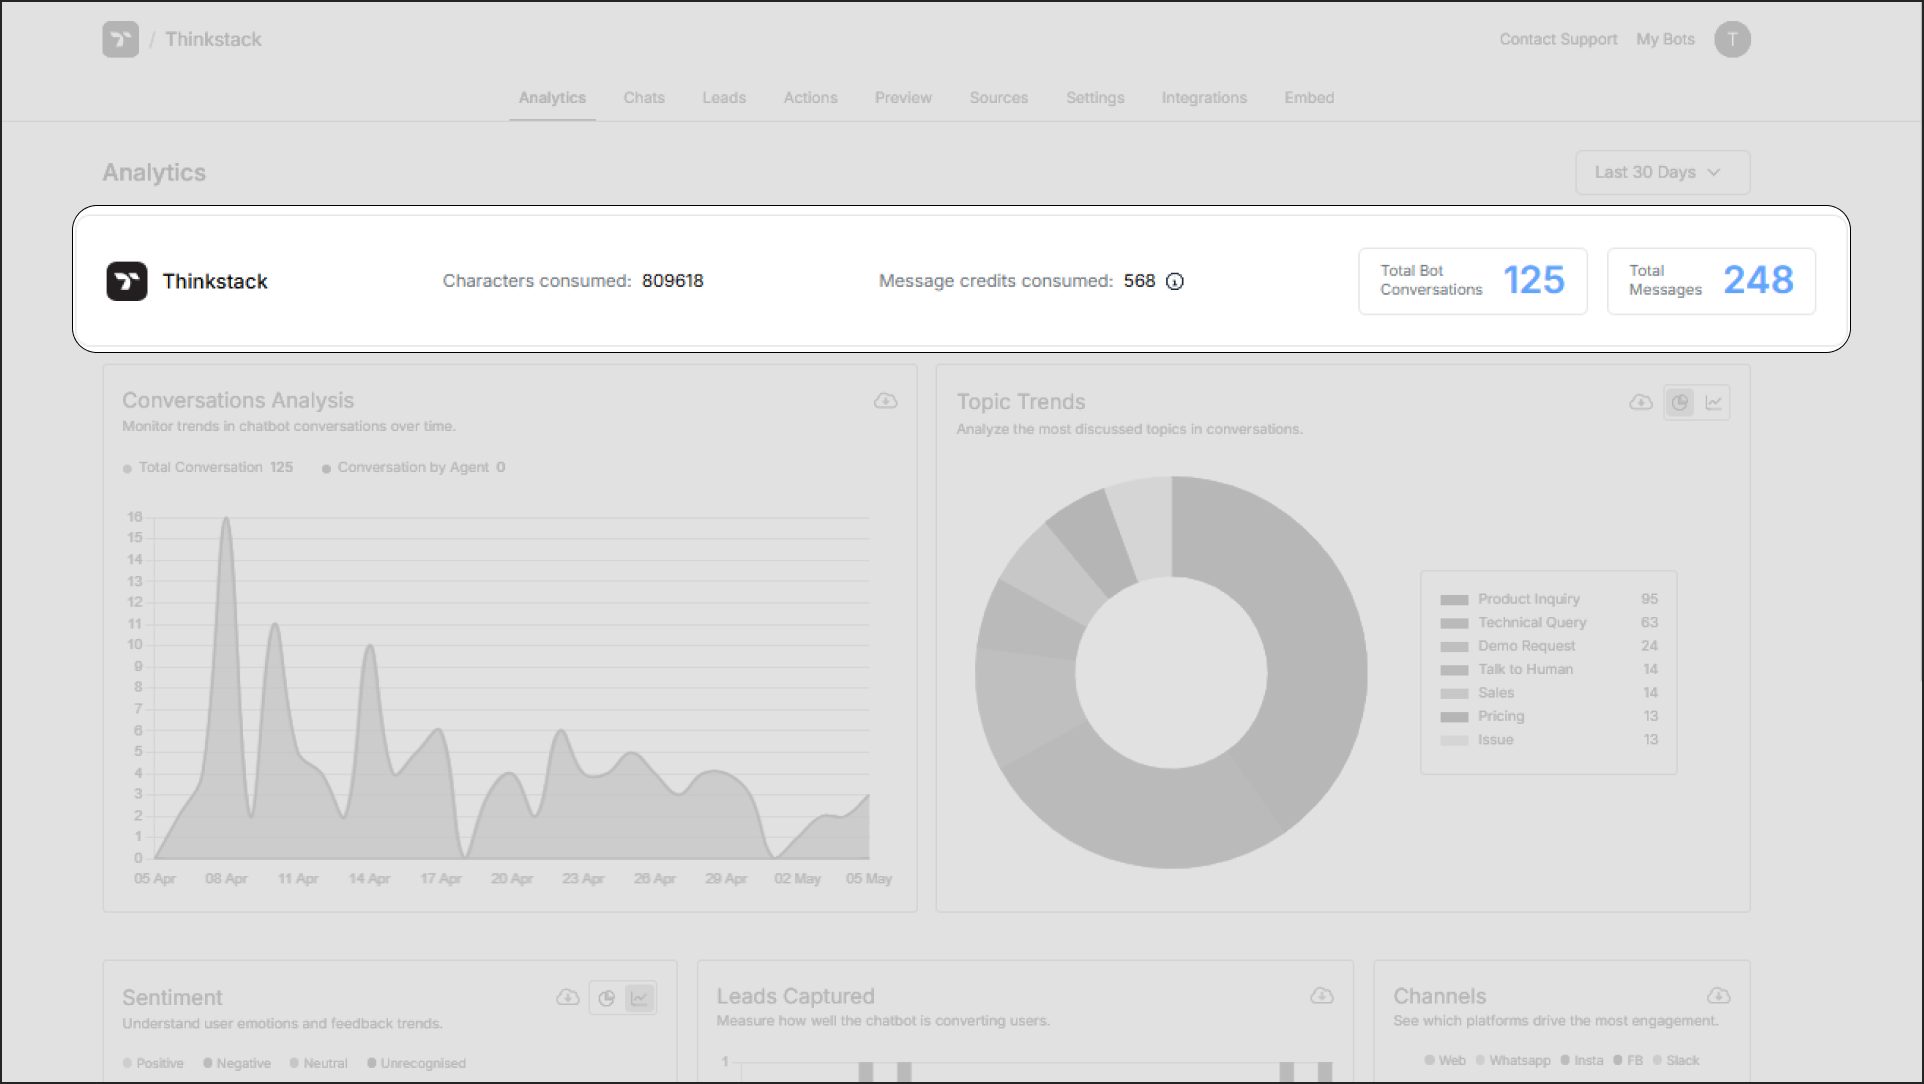 Knowledge Base Characters Used: The total number of characters utilized in training your chatbot's knowledge base.
Message Credits Consumption: The number of message credits consumed by this chatbot.
Total Conversations: The total number of conversation sessions initiated with the chatbot.
Total Messages: The total number of messages exchanged during conversations with the chatbot.
Conversations Analysis#
This section breaks down the conversation volume:
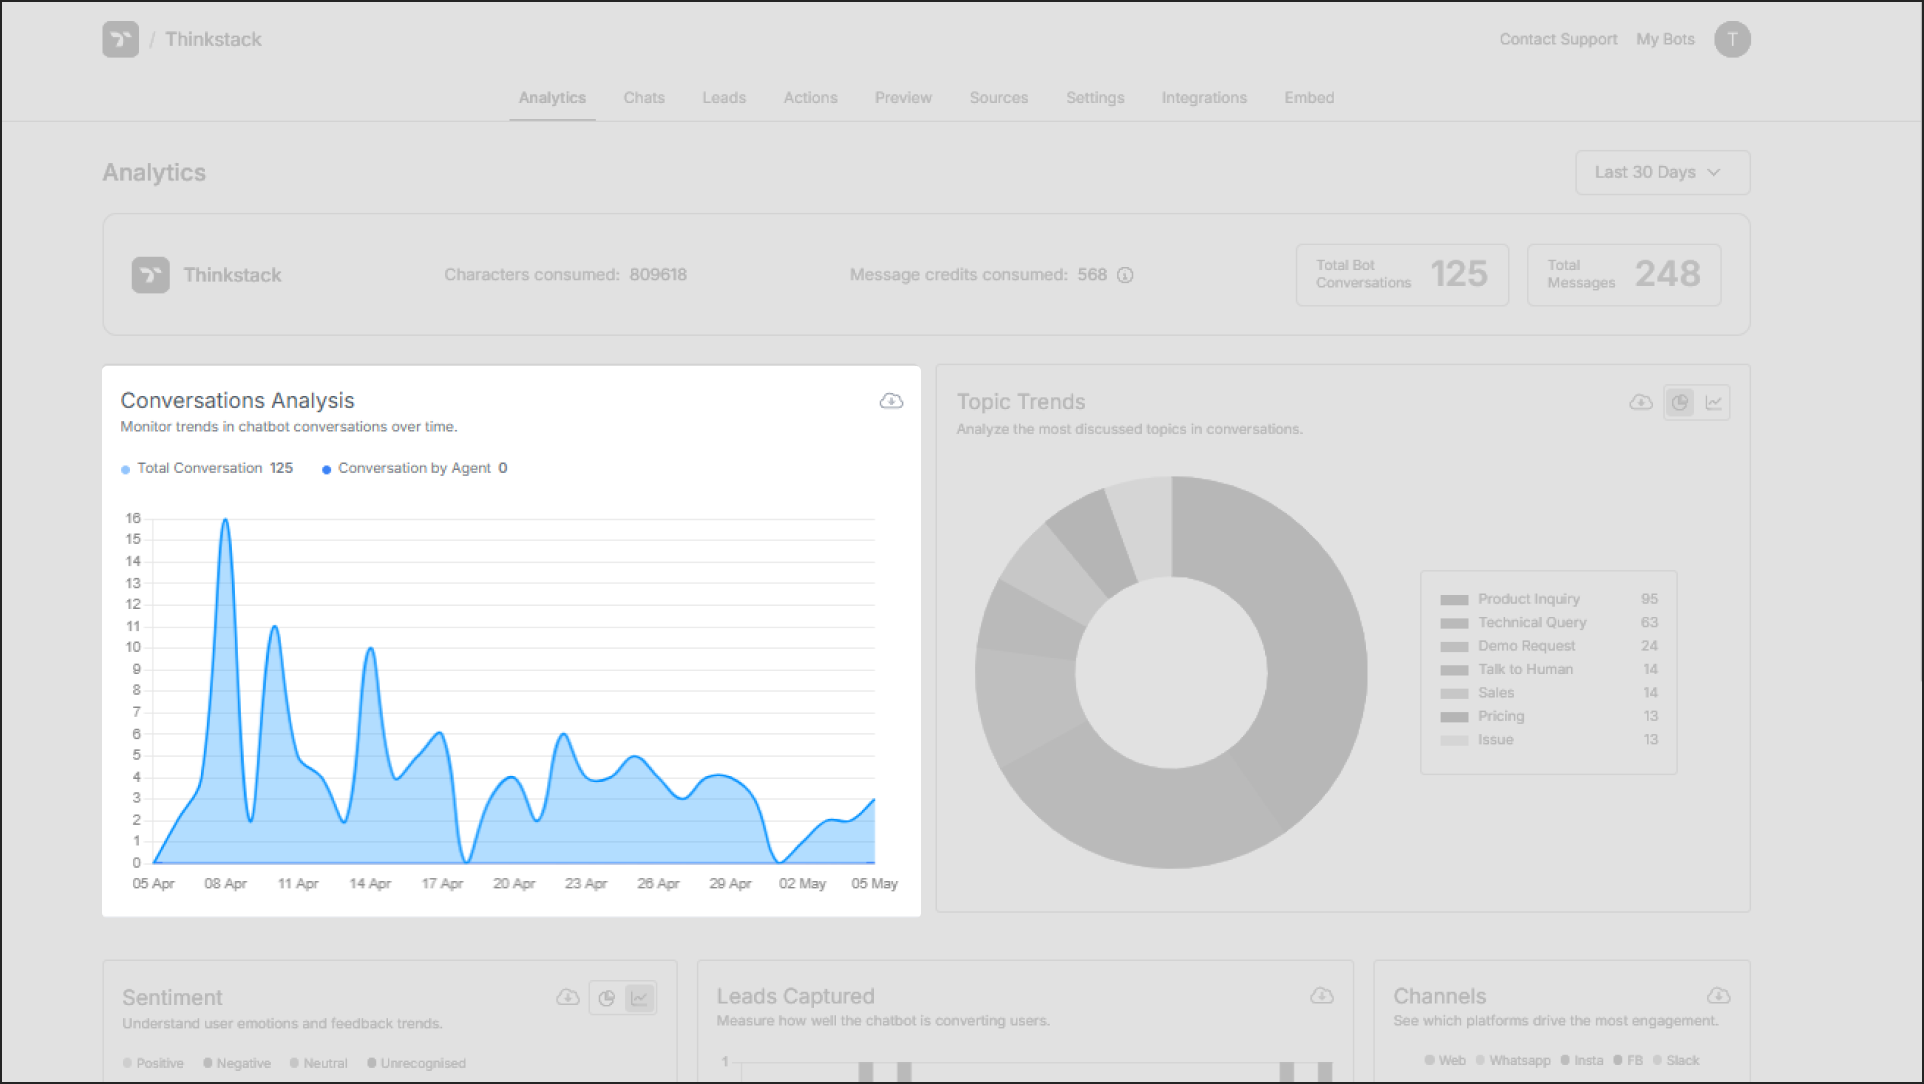
Total Conversations: The total number of conversations handled entirely by the chatbot and agent.
Conversation by Agent (Handoff): The total number of conversations where the interaction was handed off to a human agent.
These data helps you monitor the trends in chatbot conversation over time.
Topic Trends#
The Topic Trends chart (displayed as a pie chart or line chart as per your selection) provides insights into the subjects most frequently discussed by users with your chatbot. Interactions are categorized by topic, allowing you to visualize user interests and identify areas of popular inquiry.
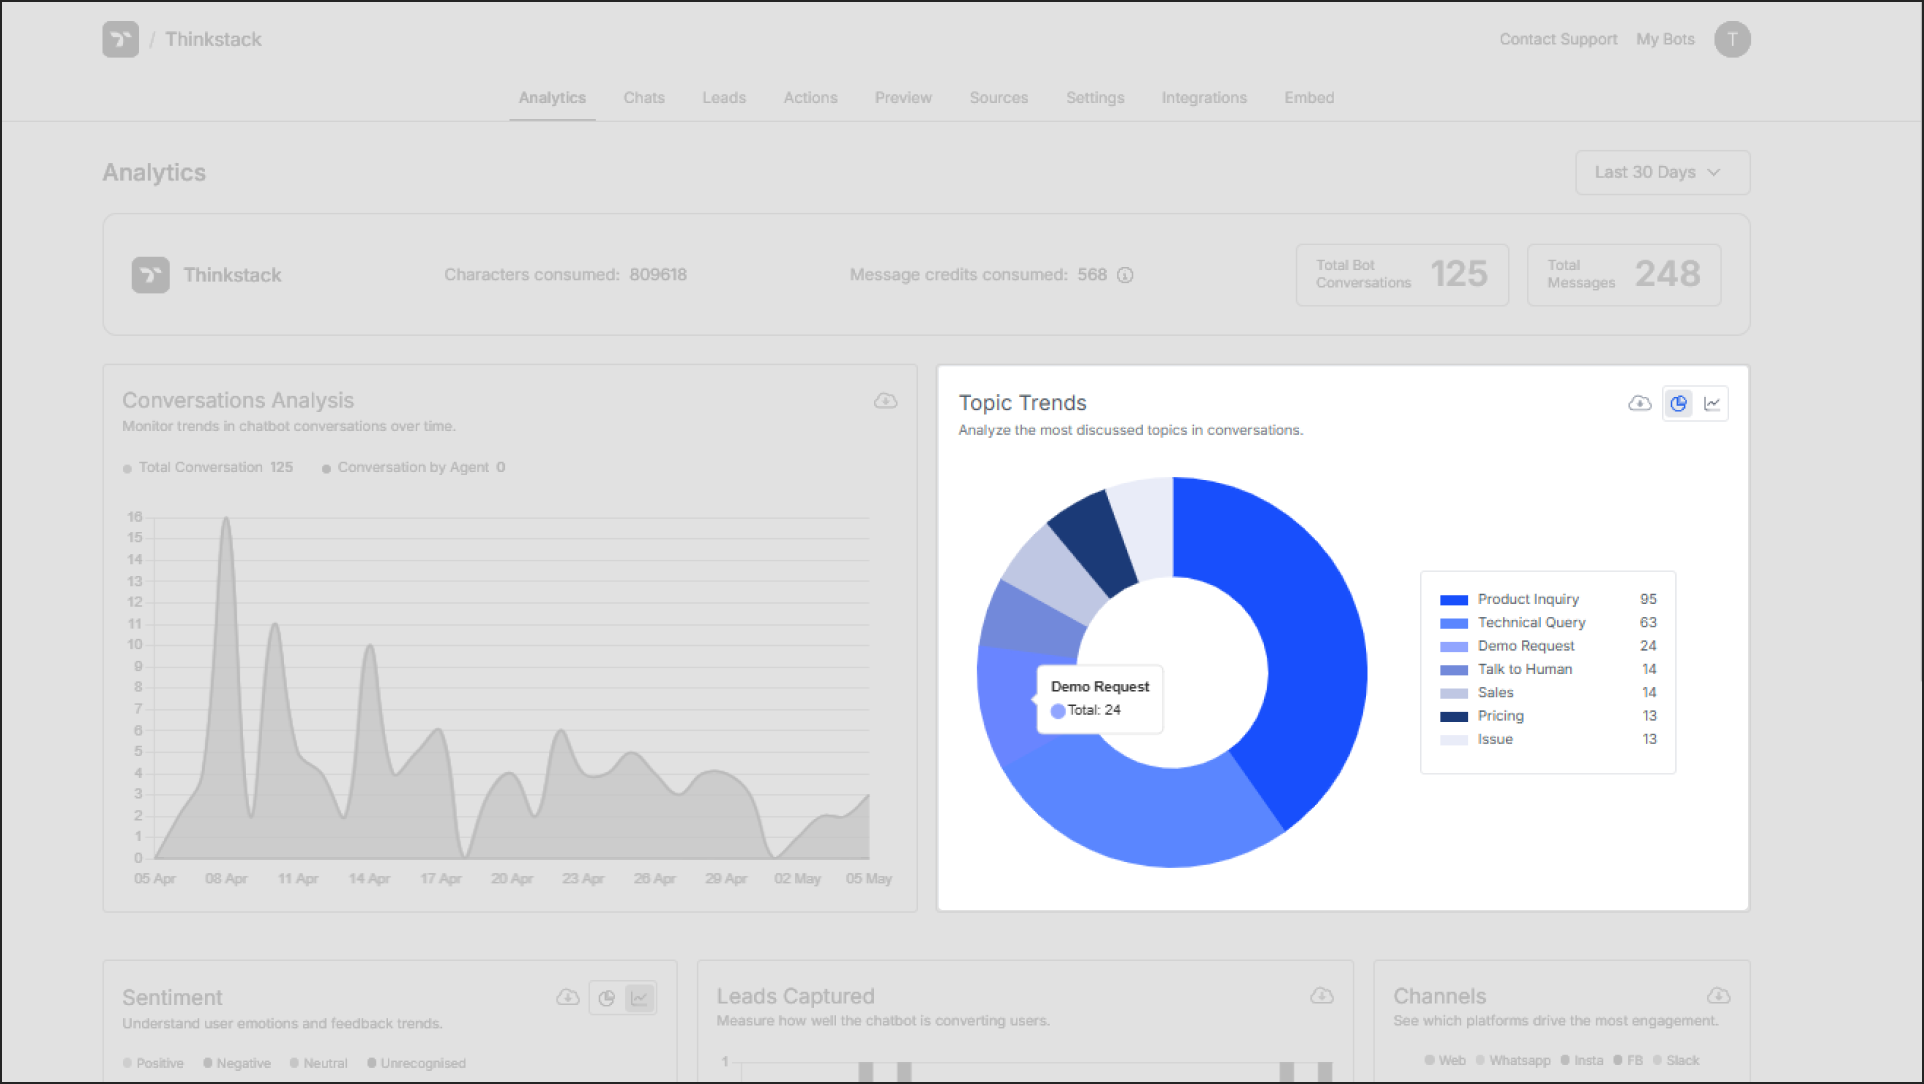
This data is invaluable for understanding what users are most interested in and can inform decisions related to product development, service offerings, and content creation.
Sentiments#
The Sentiments graph captures the emotional tone expressed by users during their interactions with the chatbot. It flags and displays the overall sentiment (e.g., positive, negative, neutral, unrecognised).
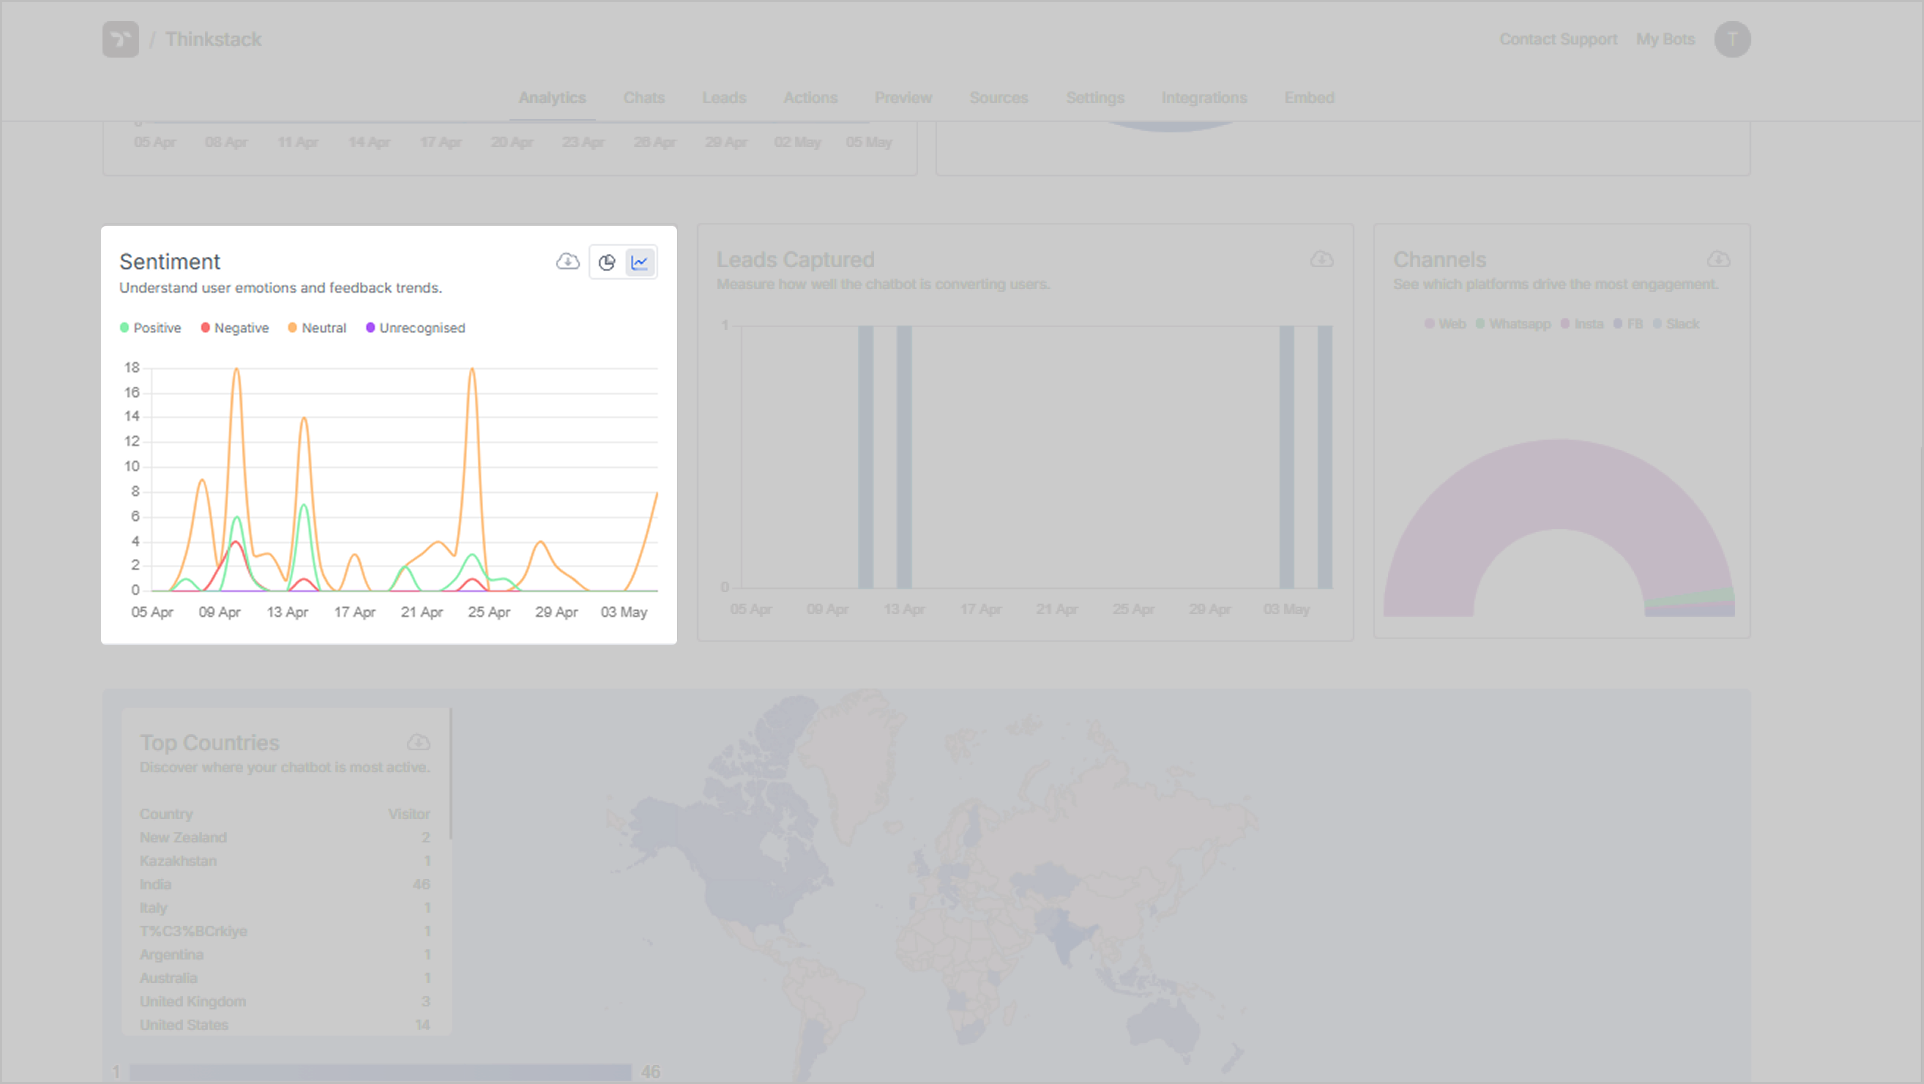
Analyzing user sentiment provides valuable feedback on how users feel about your product or service and highlights areas where users might be experiencing difficulties or expressing positive feedback.
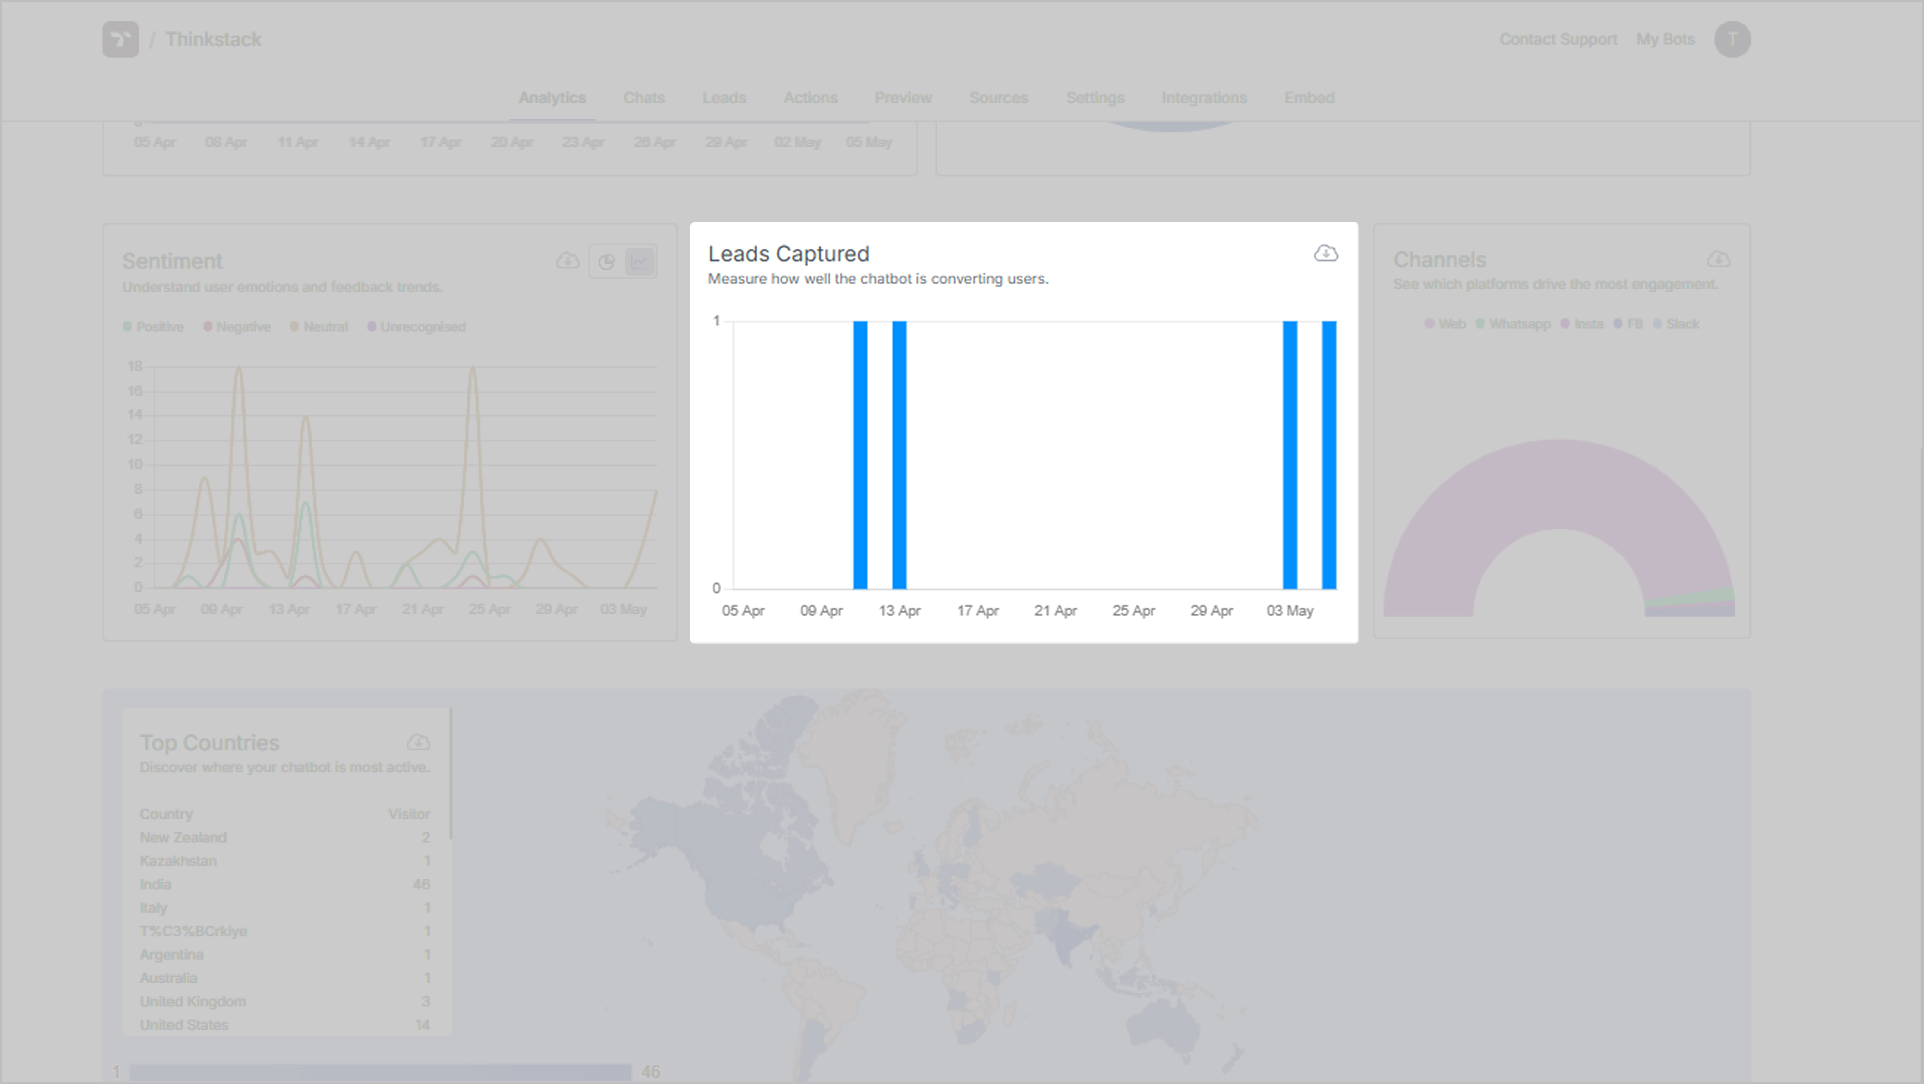
Leads Captured#
This section tracks the number of leads captured through lead forms integrated within your chatbot. The graph shows lead capture trends over time.
Channels#
The Channels section visualizes the sources of user traffic interacting with your chatbot. Since Thinkstack chatbots can be deployed across various platforms (website, social media(WhatsApp, Facebook Messenger, Instagram), team channels like Slack), this data helps you understand where your users are coming from.
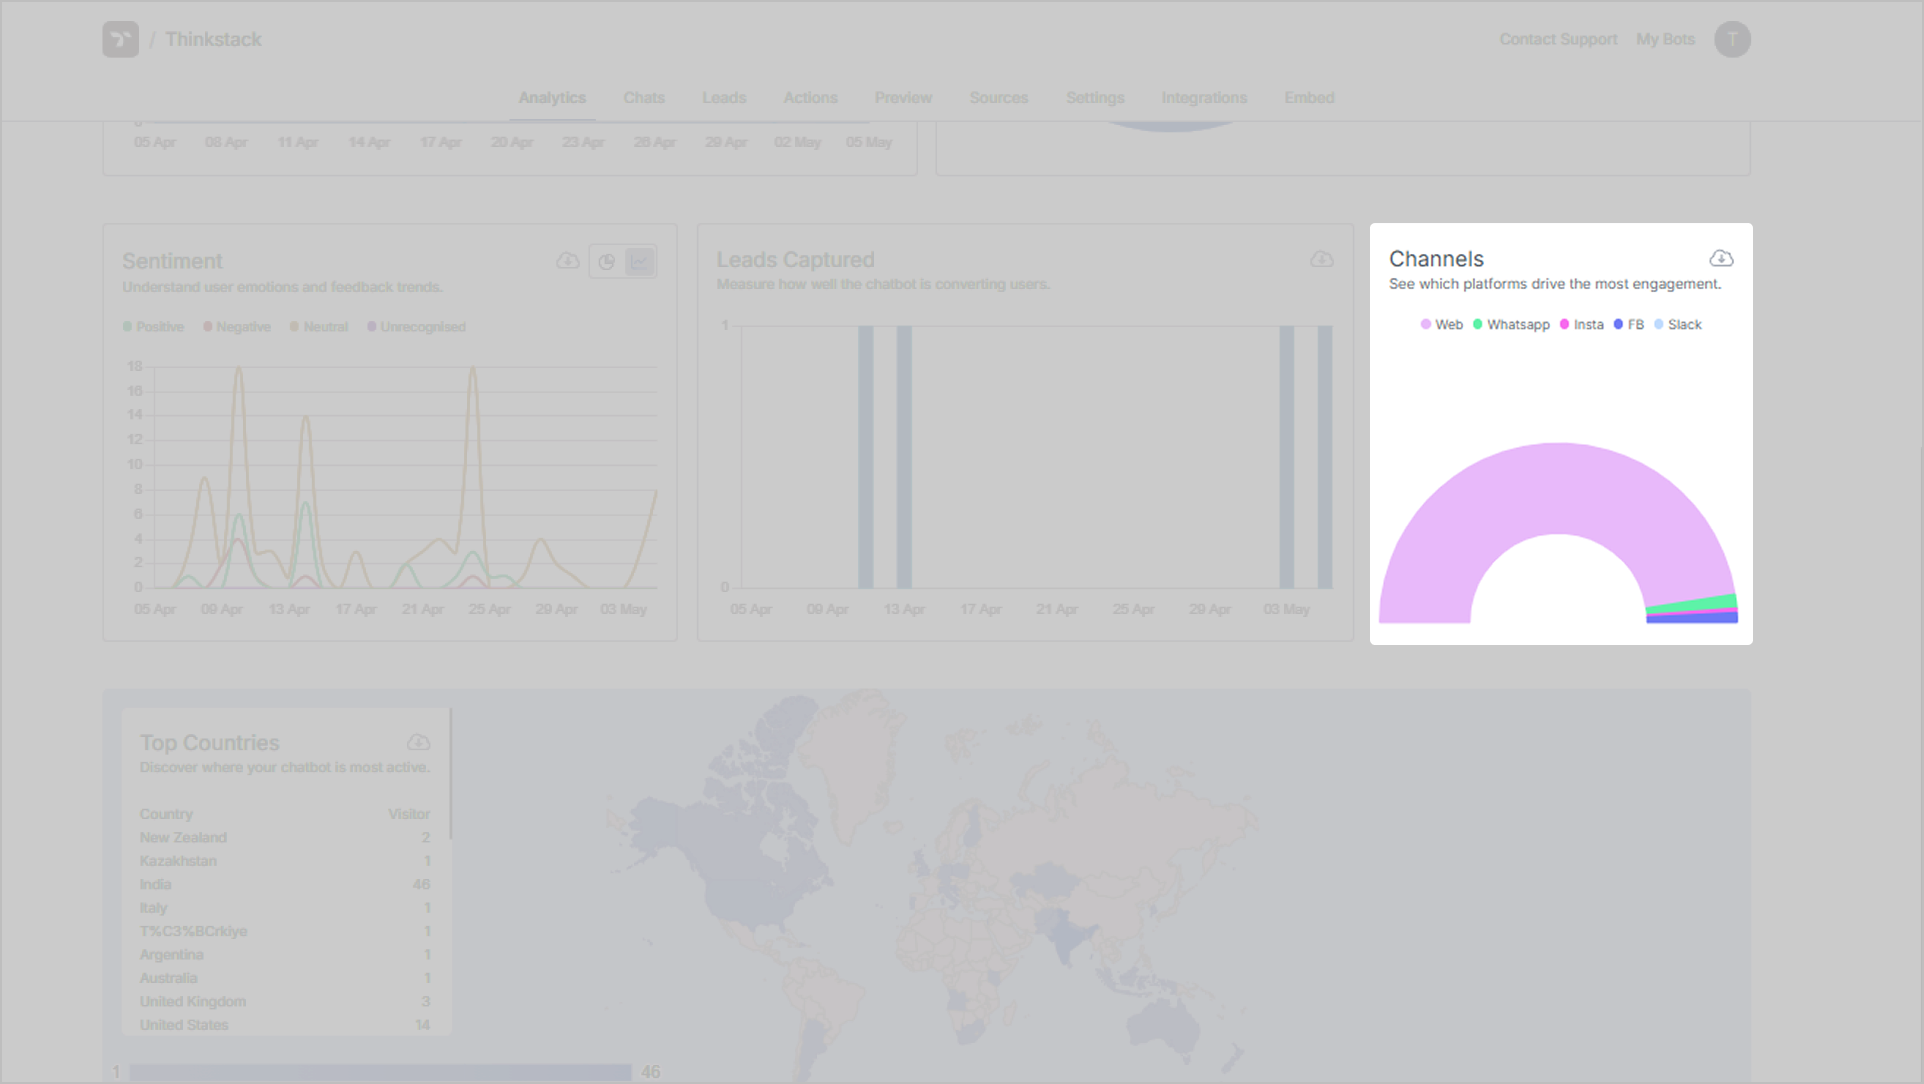
This insight is crucial for tailoring your communication strategies and focusing your efforts on platforms where you want to increase user engagement and conversations.
Top Countries#
The Top Countries section provides a visual representation of the geographical locations of users interacting with your chatbot.
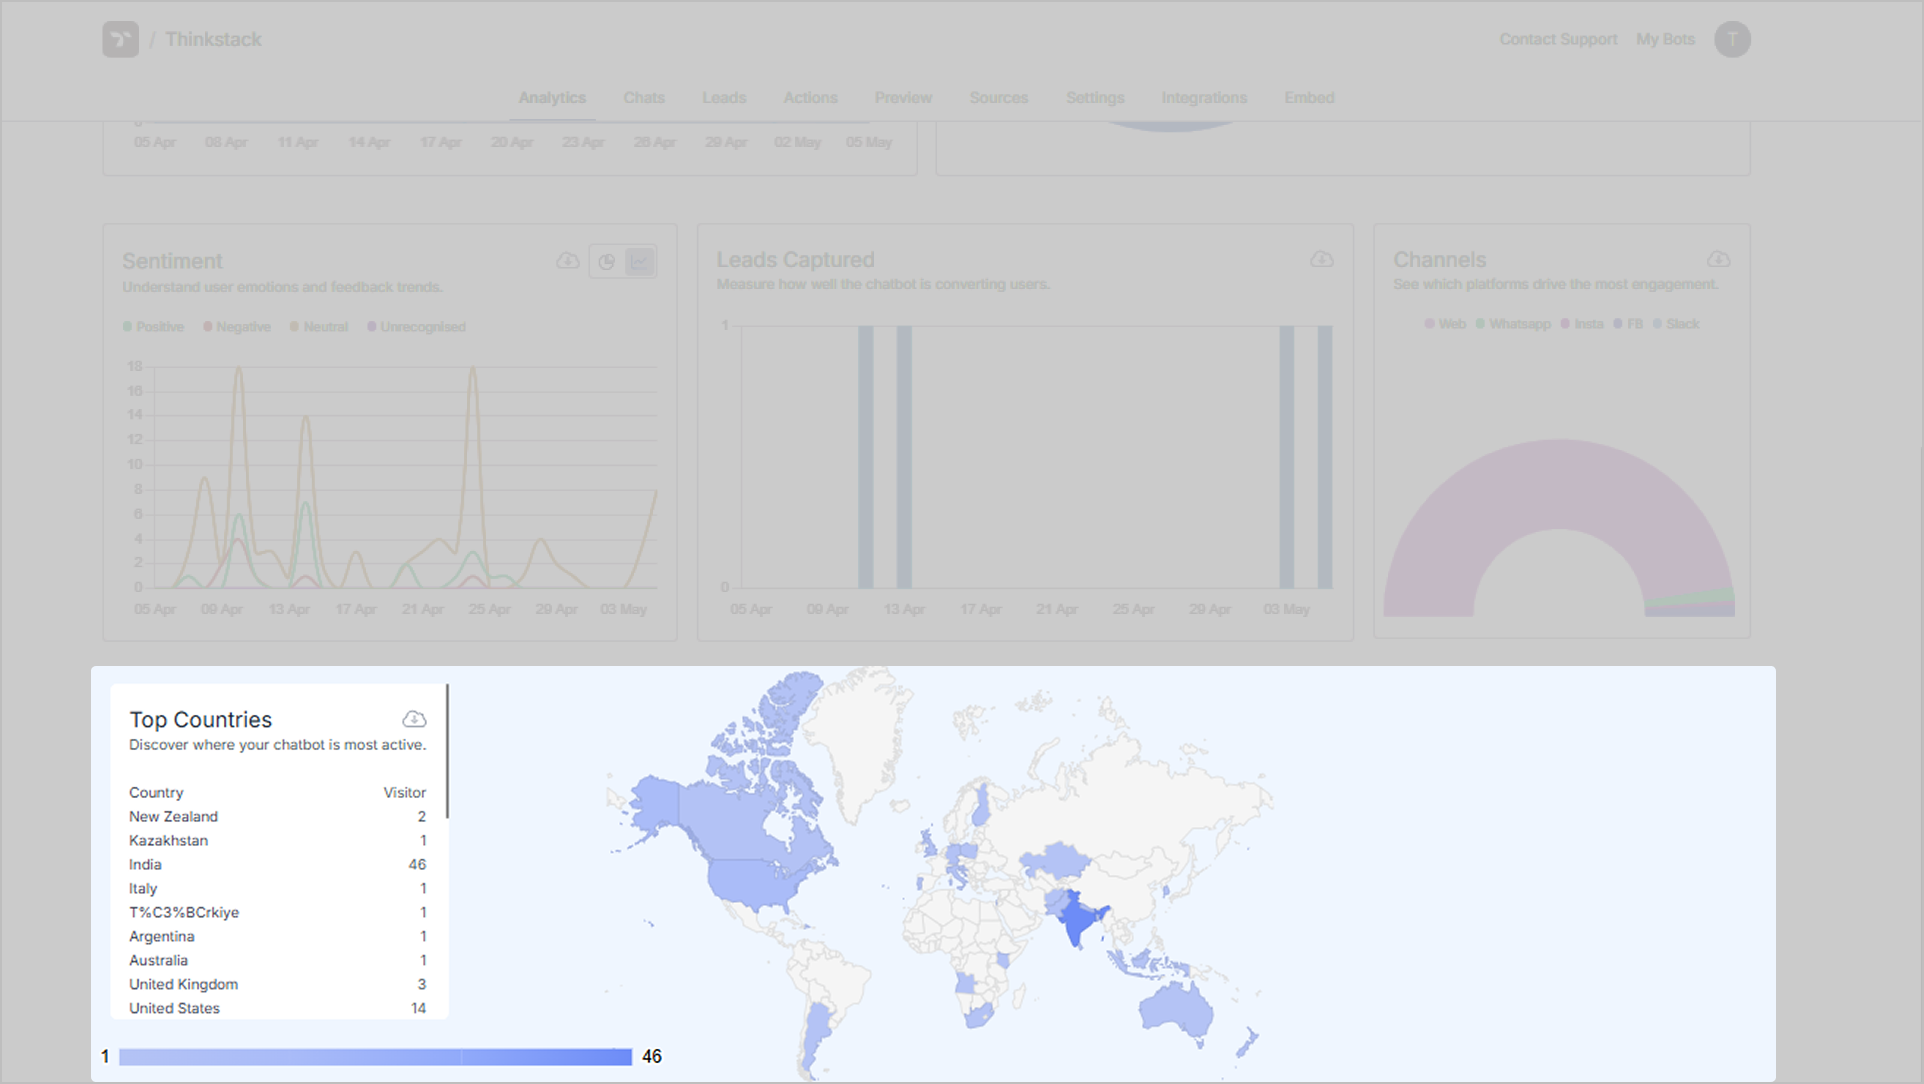
This data helps you identify which regions are most interested in your business, enabling you to make informed decisions about localization, targeted marketing, and potentially expanding your product or service offerings to better serve those audiences.